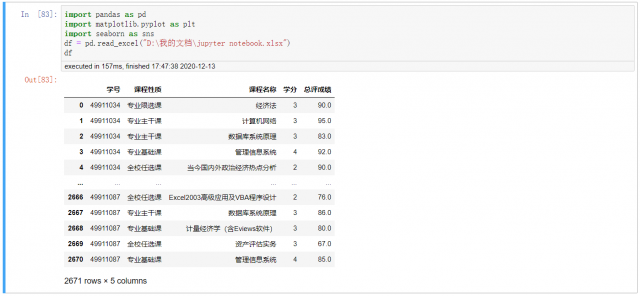
import pandas as pd
import matplotlib.pyplot as plt
import seaborn as sns
df = pd.read_excel("D:\我的文档\jupyter notebook.xlsx")
df
sns.set(style = "white", font_scale = 1.2)
# 解决中文乱码
plt.rcParams[ "font.sans-serif"] = "simhei"
# 设置字体及其大小
font1 = {"family" : "simhei",
"weight" : "normal",
"size" : 18}
# 数透
region_pivot = pd.pivot_table(df, values="总评成绩", index="课程性质", aggfunc='count').reset_index().sort_values(ascending=True,by="总评成绩")
# 设置画布大小
f, ax = plt.subplots(figsize=(8, 6))
# 绘制条形图
barh &#
本文链接:https://my.lmcjl.com/post/14442.html
展开阅读全文
4 评论