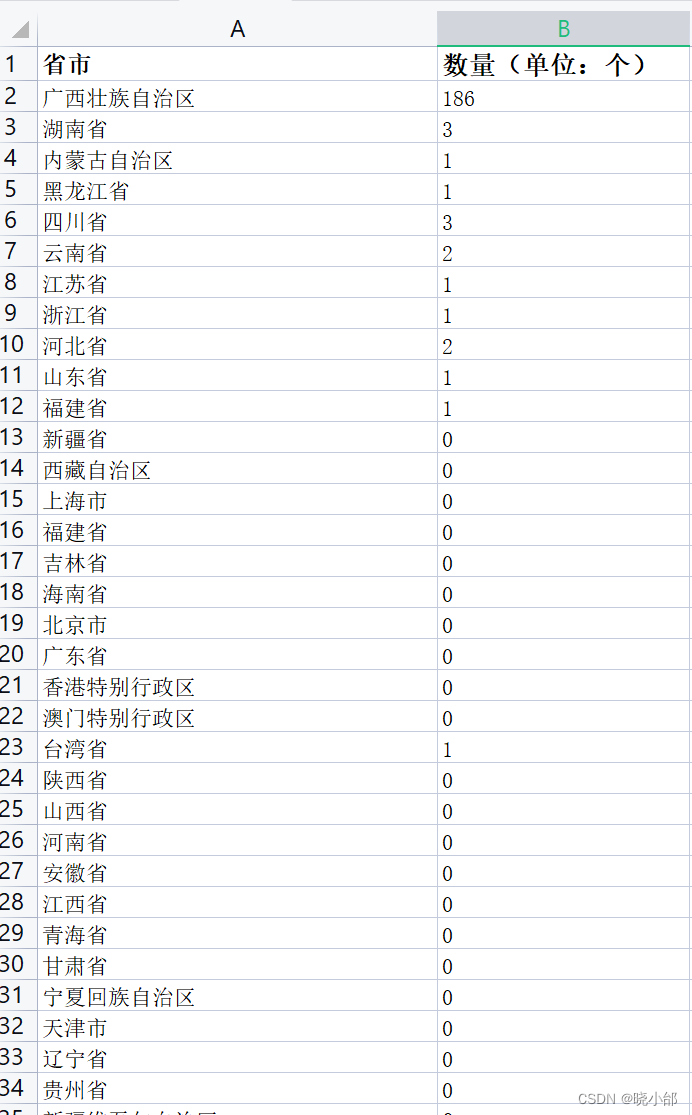
数据格式如下:
import pandas as pd
from pyecharts import options as opts
from pyecharts.charts import Map
from pyecharts.globals import ChartType# 读取Excel数据
data = pd.read_excel('C:\\Users\\Administrator\\Desktop\\国内数据.xlsx')# 创建地图实例
map_instance = Map(init_opts=opts.InitOpts(width='1920px', height='1080px'))
map_instance.set_global_opts(title_opts=opts.TitleOpts(title='中国地图可视化'))# 添加数据
for index, row in data.iterrows():map_instance.add(series_name=row['省市'],data_pair=[(col, val) for col, val in zip(row[0:], row[1:])],maptype='china',label_opts=opts.LabelOpts(is_show=True, font_size=16,),)# 设置VisualMap组件
map_instance.set_global_opts(visualmap_opts=opts.VisualMapOpts(min_=data[data.columns[1:]].min().min(),max_=data[data.columns[1:]].max().max(),is_piecewise=True,# range_color=['#FFD700', '#FF4500'], # 设置颜色范围pos_top='middle',pos_left='right',),)
# map_instance.set_series_opts(
# label_opts=opts.LabelOpts(formatter="{value} 单位") # 在标签中添加单位说明
# )
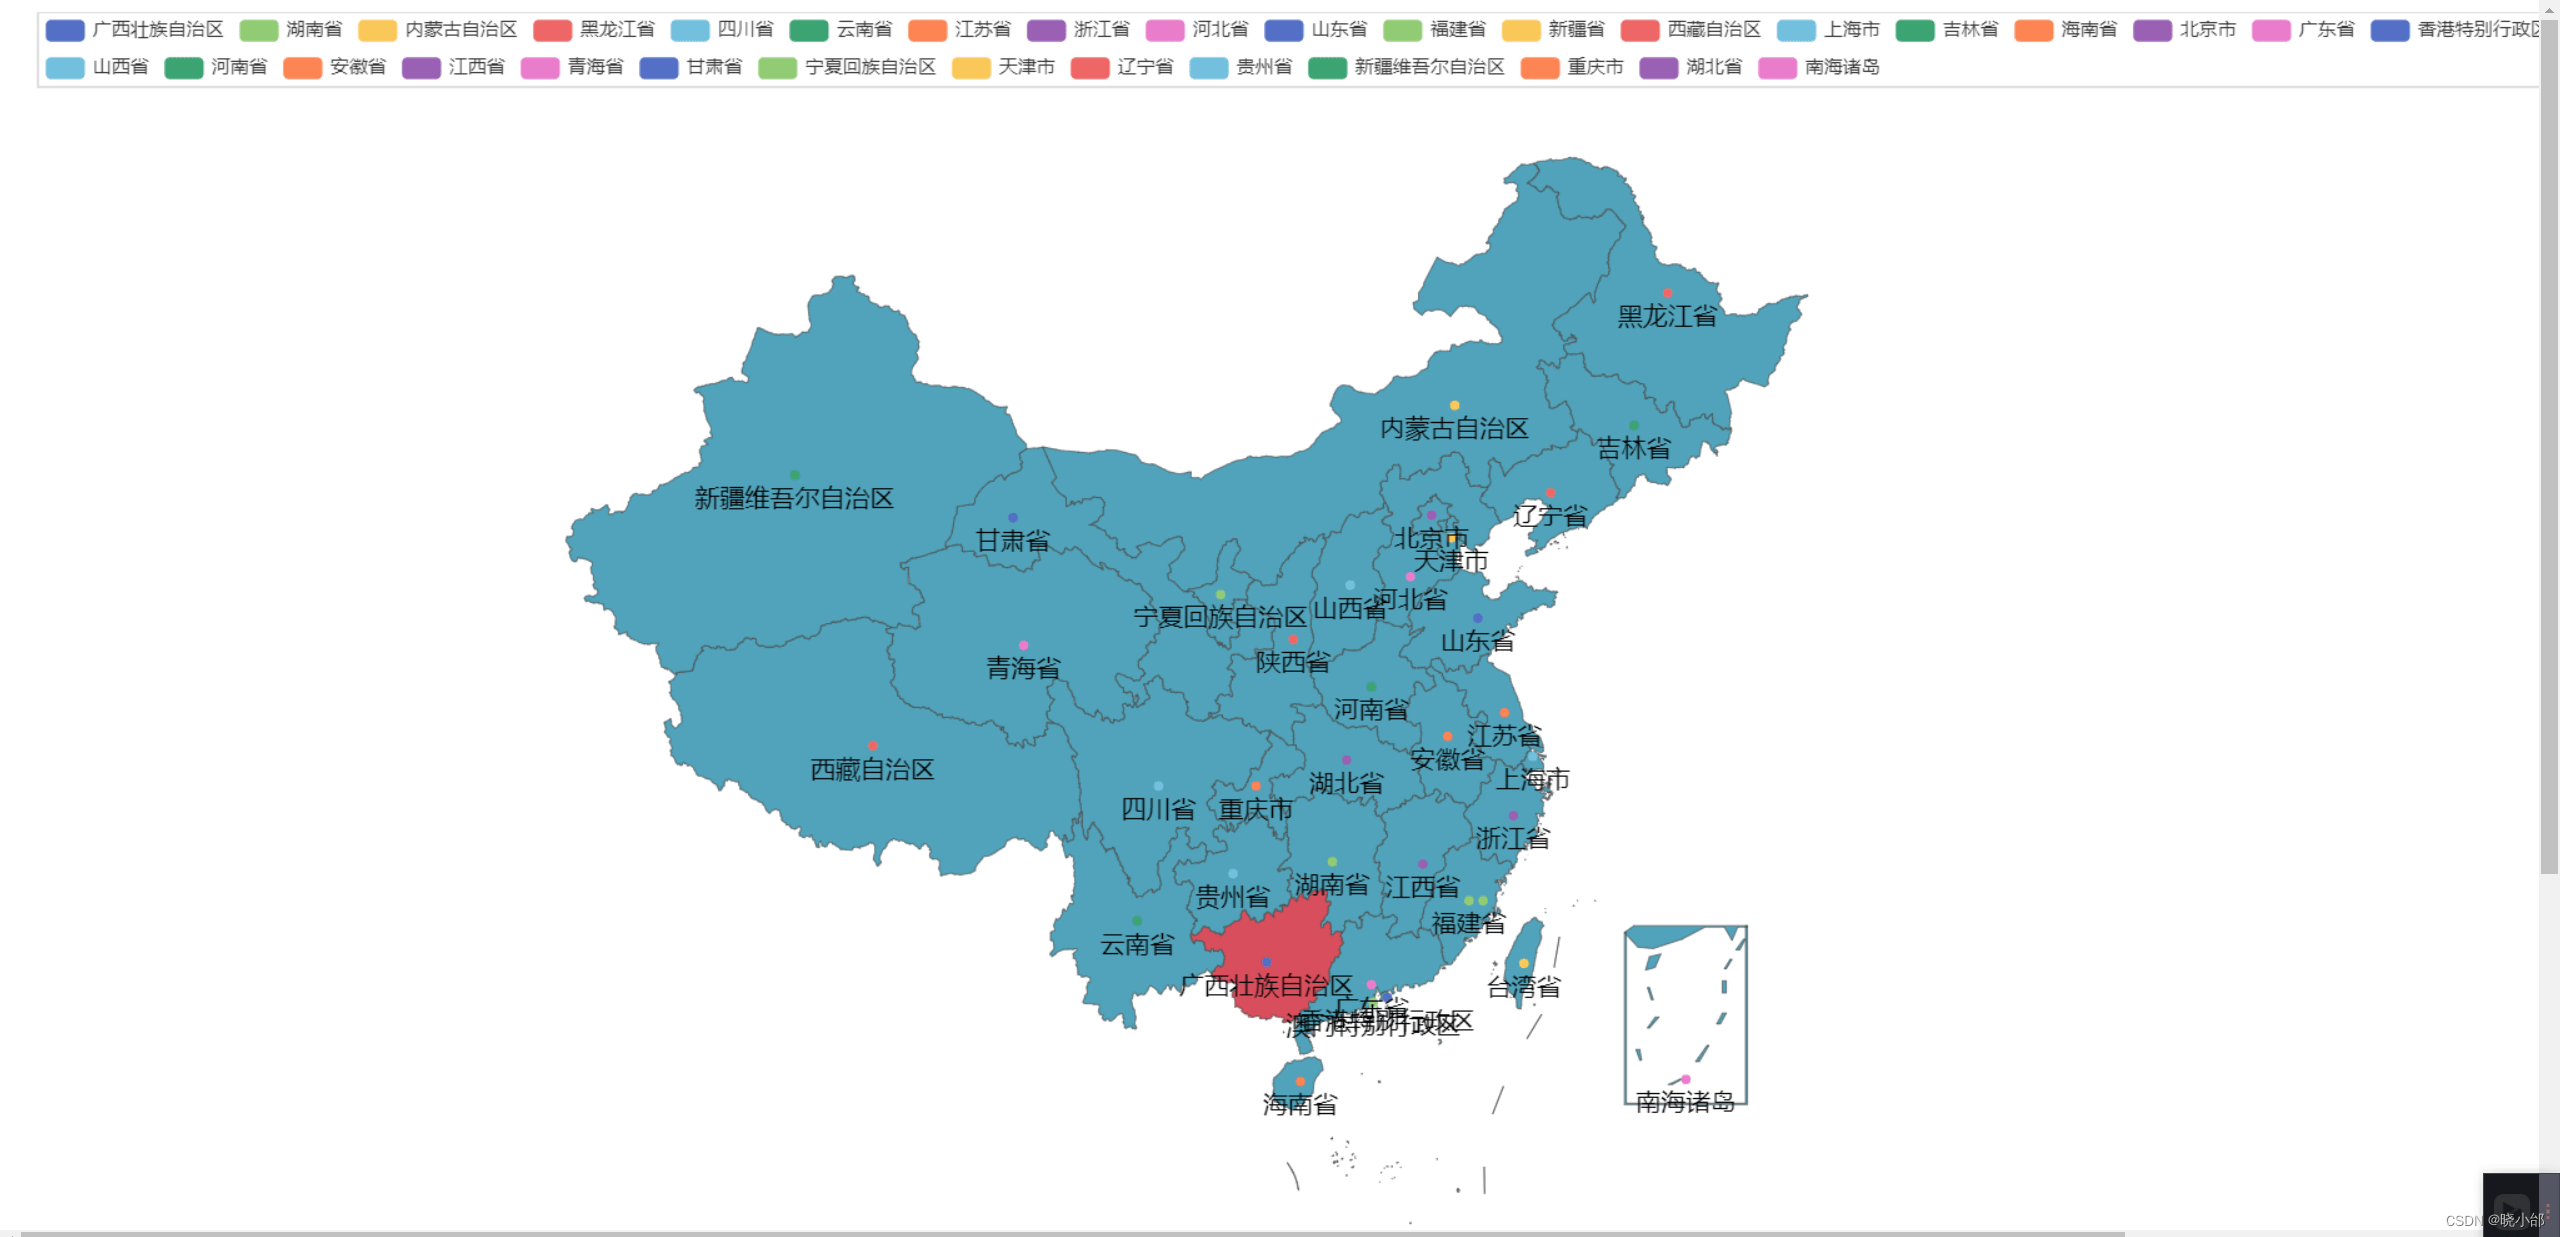
# 渲染地图
map_instance.render('map.html')效果如下:
本文链接:https://my.lmcjl.com/post/12576.html
展开阅读全文
4 评论